Measurement of Static Convergence and Accommodation Responses to Images of Integral Photography
Hitoshi HIURA, Kazuteru KOMINE, Jun ARAI and Tomoyuki MISHINA
Integral photography is a method to display 3D optical images by reproducing exactly same light rays which are emitted from the objects. In this study, the static convergence and accommodation responses were measured comparing three types of targets of integral photography images, binocular stereoscopic images, and real objects. Those targets were indicated to be placed at visual distances ranging from 450 mm to 900 mm. The results showed that the convergence responses for the integral photography and binocular stereoscopic images exhibited the same tendency as for the real objects. On the other hand, the accommodation responses to the integral photography images showed more similar tendency to those to the real objects, while the responses to the binocular stereoscopic images showed less similarity to those to the real objects. These results suggested that the static convergence and accommodation responses to the integral photography images showed more similarities to those to the real objects compared with those to the binocular stereoscopic images.
1. Introduction
3D video through binocular 3D schemes utilizing binocular parallax*1 are common in movies and other media. Binocular schemes require a mechanism such as special glasses or a lenticular lens*2 to present the different parallax images to the viewer’s left and right eyes. The viewer can see three dimensions owing to the parallax between the two eyes, and the viewer’s convergence*3 corresponds to the position of the 3D image. On the other hand, the viewer’s focal accommodation is close to the display, and this discrepancy with the convergence has been identified as a cause of fatigue1).
On the other hand, integral methods2) capture and reproduce information about the light rays emanating from objects, so in principle, there should be no discrepancy between convergence and accommodation. This has been supported by reports of earlier research measuring the accommodation response*4 while viewing integral images3)4). We have investigated whether there is any inconsistency between the depth perceived subjectively when viewing 3D images produced by integral methods and the depth obtained when measuring the accommodation response within a certain range of depths5). With integral methods, the maximum spatial frequency that can be reproduced in integral images is limited by the display-device pixel pitch and the lens-array lens pitch6), and we have reported on how the subjective perception of depth also changes with the resolution of 3D images7). However, there have been no reports regarding the relationship between the convergence response*5 and accommodation response when viewing 3D images produced with integral methods. Thus, we have measured and report on the static convergence and accommodation characteristics when viewing integral 3D images. For comparison, we also performed similar measurements during the viewing of targets*6 using binocular stereoscopic 3D techniques and during the viewing of real objects.
This article first gives an overview of our experiments, discussing the experimental setup for measuring the convergence and accommodation, the visual targets presentation method, and the experimental procedure. Then it gives the results of measuring the convergence and accommodation responses when viewing targets as integral 3D images, as binocular stereoscopic 3D images, and as real objects. Finally, we discuss the convergence and accommodation responses during the viewing of each target on the basis of the experimental results.
2. Experimental Overview
In this experiment we measured the convergence and accommodation responses when viewing targets displayed at different depths. The targets were displayed in three ways: as integral 3D images, as binocular stereoscopic 3D images, and as real objects. To compare the convergence and accommodation responses for integral and binocular stereoscopic imaging, the target display position and resolution were controlled. The 3D image display equipment was positioned at a viewing distance of 600 mm, and visual targets were presented at eight depths in the range of ±0.56 D*7 from the display equipment. The target resolution was adjusted to be roughly the same for the integral and binocular stereoscopic displays. The target depth was fixed at the time of measurement, and the static convergence and accommodation responses were measured at the same time.
2.1 Equipment
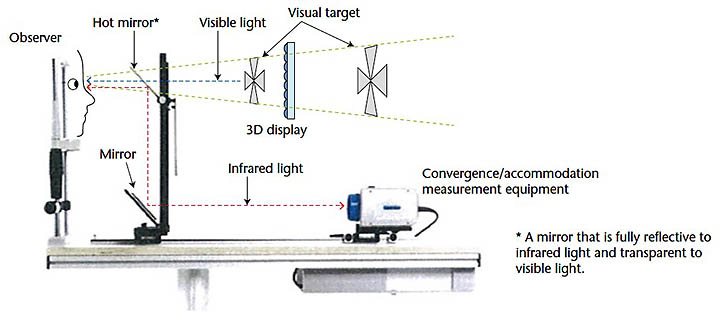
The equipment used for these experiments is shown in Fig. 1. It consists of equipment that measures the convergence and accommodation responses and 3D video display equipment to display the targets.
To measure the convergence and accommodation, we used the PowerRef3 instrument from Plusoptix GmbH, which uses the photoreflection method8)*8. This instrument was positioned 1.0 m from the participant (the observer) and optical measurements were performed using infrared light. A hot mirror followed by a mirror were placed in the space from the observer to the equipment. The hot mirror totally reflects infrared light and is transparent to visible light. This enabled the device to measure the convergence and accommodation using infrared light while the subject is viewing the targets. The equipment was placed 1.0 m from the observer, so the accommodation response measurements included a distance of +1.0 D.
We used 3D display equipment consisting of an LCD display and a lens array. The LCD display had 1,920 (H) × 1,080 (V) pixels with a 55.5 μm pixel pitch, a 4.8-inch diagonal screen, an RGB stripe*9 pixel structure, and 60 Hz frame frequency. The lens array consisted of 106 (H) × 69 (V) individual hexagonal microlenses precisely aligned in a honeycomb pattern, each with a focal distance of 3.0 mm, a horizontal lens pitch of 1.0 mm, and a vertical lens pitch of 0.866 mm. The lens array and LCD display were fixed such that the focal points of the lens array were located on the LCD display surface to create a 3D video display. The specifications of the convergence and accommodation measurement device (PowerRef3) and the 3D display are shown in Table 1.
| Equipment parameter | Value |
|---|---|
| Convergence/accommodation measurement equipment (PowerRef3) |
|
| Pupil size (mm) | 4.0-8.0 |
| Measurement speed (Hz) | 50 |
| LCD display | |
| Number of pixels | 1,920 (H) × 1,080 (V) |
| Pixel size (μm) | 55.5 |
| Display size (inches) | 4.8 |
| Pixel structure | RGB stripe |
| Lens array | |
| Focal length (mm) | 3.0 |
| Horizontal pitch (mm) | 1.0 |
| Vertical pitch (mm) | 0.866 |
| Number of lenses | 108 (H) × 69 (V) |
| Lens arrangement | Honeycomb pattern |
2.2 Visual target presentation
We now describe the presentation of targets using the 3D display. For both integral and binocular stereoscopic viewing, the 3D display was set 600 mm away from the observer, as shown in Fig. 2 (a), and targets were displayed at eight points with different depths using each method. The depth positions of the targets were determined in order to measure the effect of the convergence accommodation*10 in the depth of field*11 of the ocular optics. The depth of field of the human eye is ±0.2 to 0.3 D9). The targets were placed at eight distances from the observer: 450 mm (-2.22 D = -1/0.45 D), 500 mm (-2.00 D), 550 mm (-1.82 D), 600 mm (-1,67 D = display surface), 650 mm (-1.54 D), 700 mm (-1.43 D), 750 mm (-1.33 D), and 900 mm (-1.11 D). These positions were no more than ±0.56 D from the 3D display equipment. To present a real target, the target was displayed at the surface of the 3D display, and the display itself was moved to one of the above positions, as shown in Fig. 2 (b). This enabled the targets to be displayed using the same equipment for each of the three types of image.
We next describe how the targets were created. We used a 2D Maltese cross pattern*12 for the experiments. To control for subjective perception of depth, we adjusted the size of the targets according to their display position so that they appeared to be the same size, spanning a visual angle of approximately 1.9 degrees. This means that the size of the target was 20 mm × 20 mm on the 3D display screen at a viewing distance of 600 mm, as shown in Fig. 3.
As mentioned earlier, the maximum spatial frequency that can be expressed in a 3D image using the integral method is limited by the pixel pitch of the display device and the lens pitch of the lens array6). Because the accommodation responses depend on the target resolution10), the accommodation position is induced to the convergence position by convergence accommodation when viewing a 3D target with low resolution. Therefore, it was necessary to make the binocular stereoscopic target resolution about the same as for the integral 3D (I3D) target. Specifically, we first performed a numerical simulation by ray tracing using geometrical optics to generate the targets for use with the integral method at each depth, and then from these targets, we generated targets to be used with the binocular stereoscopic method, ensuring that their resolution characteristics were the same. To generate the targets for the binocular stereoscopic method, the viewing distance from the observer to the 3D display and the interpupilary distance of the observer are needed. For these experiments, we took the viewing distance to be 600 mm and the interpupilary distance to be 65 mm. When viewing real objects, observers were able to recognize the shape of the lens array at the target position, and the targets were displayed at the surface of the 3D display, so we took the resolution of the target for real-object viewing to be the same as the resolution of the lens array.


2.3 Procedure
In these experiments, a static target was displayed, participants observed it with both eyes, and any changes in the convergence and accommodation positions were measured over a period of ten seconds. The three types of target (integral image, binocular stereoscopic image, and real object) were presented with their position changed randomly. In one sequence of measurements, measurements of one type of target at eight depths were taken. To increase the accuracy of measurements, each of the target conditions was presented and measured four times. As a result, for each participant, a total of 96 measurements were taken, i.e., three target display methods, eight target positions, and four repetitions each. We also gave the participants a rest of at least ten seconds before changing the target position and performing the measurement, and a rest of at least five minutes between each sequence. Participants were not informed of the depth of the target and were instructed to look at the target so that it did not appear as a double image. The experiments were performed in a dark room, so the pupils of the participants were dilated, and no devices such as artificial pupils were used. The participants were four women with ages between 20 and 30 inclusive having normal vision with visual acuity of 1.0 or higher. We confirmed that the participants were capable of binocular vision by performing the Stereo Fly Test*13 from Stereo Optical Inc.
3. Results
Figure 4 and Figure 5 show experimental results of four observers (A, B, C, and D) for the convergence and accommodation responses to the I3D targets, binocular stereoscopic (S3D) targets, and real objects (RO). The horizontal axes of the graphs show the target display position and the vertical axes show the convergence or accommodation result. The measurements of the convergence position for both eyes and the accommodation position for each of the left (L) and right (R) eyes from the convergence/accommodation-response-measuring equipment are given in terms of the distance from the participants’ eyes. The solid line with a slope of 1 in each figure represents the convergence or accommodation response if the measured results had matched the target positions. The symbols correspond to the target types: ○ (I3D) for the integral method, △ (S3D) for the binocular stereoscopic method, and × (RO) for real objects. The error bars indicate the standard deviation. Note that the accommodation unit of the diopter (D) and the convergence unit of the meter angle (MA) are different representations, but both are inverses of the distance (m) so they represent the same quantity.
From the experimental results shown in Fig. 4, for all the target display methods, the convergence responses were at a position more distant than the target display position at each target display position. However, the convergence response for changes in the target position had a similar slope to the solid line, which shows the change in the target position. Concerning the convergence responses at the viewing distance of 450 mm (-2.22 D), the S3D target results for observer C were apparently different from those for viewing the real targets. In this case, the difference was 0.5 MA or more relative to the convergence responses to the real targets.
In the measurement results shown in Fig. 5, there were also individual differences in the magnitude of the accommodation responses. In addition to differences between target types, there were differences in the accommodation responses between the left and right eyes. The accommodation responses to the I3D targets were more similar to those to the real targets while the responses to the S3D showed less similarity to the real targets.


4. Discussion
The individual differences in the results of the convergence and accommodation responses made it difficult to understand the relationship with the target depth positions. Therefore, to remove the effects of these individual differences, we used those of the real targets as a reference for comparing the responses to the 3D targets. Then we examined the responses from the point of view of the slope.
4.1 Convergence Responses
Figure 6 shows the convergence response results from Fig. 4, plotted with the convergence response when viewing a real object on the horizontal axes and those when viewing targets using the integral (I3D) and binocular stereoscopic (S3D) methods on the vertical axes. The solid lines with a slope of 1 show when the convergence position is the same in the cases of viewing the target as a real object and as a 3D image. The least-squares linear approximation of the results from each viewing method is also shown. Table 2 gives the results of computing the slope of the approximation for each participant. The average slopes for the integral and binocular stereoscopic methods for all participants were 0.982 and 0.894, respectively, and the integral method exhibited a convergence response closer to that in the case of viewing real objects than the binocular stereoscopic method by a slope of approximately 0.1. This may have been due to the large difference in the convergence position between binocular stereoscopic viewing and real object viewing for participant C at the viewing distance of 450 mm (target position = -2.22 D) (see Fig. 4). The average slopes of the convergence responses for the integral and binocular stereoscopic methods for the three participants excluding participant C were 0.995 and 0.950, respectively, a difference of only 0.045. From this result, we can conclude there was no significant difference in the convergence responses of the participants, excluding participant C, for the integral and binocular stereoscopic method results.

| Participant | Integral method | Binocular stereoscopic method |
|---|---|---|
| A | 0.015 | 0.881 |
| B | 1.115 | 1.127 |
| C | 0.943 | 0.728 |
| D | 0.855 | 0.841 |
| Average value | 0.982 | 0.894 |
4.2 Accommodation Responses
Figure 7 shows the accommodation response results from Fig. 5, plotted with the accommodation response when viewing a real object on the horizontal axes and those when viewing targets using the integral (I3D) and binocular stereoscopic (S3D) methods on the vertical axes. The solid lines with a slope of 1 show when the accommodation position is the same in the cases of viewing the target as a real object and as a 3D image. The least-squares linear approximation of the results from each viewing method is also shown. Table 3 gives the results of computing the slope of the approximation for each participant. The slopes of the accommodation responses for the left and right eyes were different: the averages for the integral method were 0.825 (left) and 0.788 (right) and those for the binocular stereoscopic method were 0.588 (left) and 0.615 (right). This resulted in a difference in the slope of approximately 0.2 between the integral and binocular stereoscopic methods for both eyes. The accommodation response with the integral method was closer to that in the case of viewing real objects than that with the binocular stereoscopic method. Excluding participant D, who had lower accommodation response slopes, the average values for the other three participants were 0.924 (left) and 0.874 (right) for the integral method, and 0.676 (left) and 0.694 (right) for the binocular stereoscopic method. From these results, the average slope of the accommodation response for three of the four participants (A, B, C) and both eyes was approximately 0.9 for the integral method and 0.7 for the binocular stereoscopic method, indicating that the accommodation response with the integral method is closer to that when viewing real objects than it is with the binocular stereoscopic method.

| Participant | Integral method | Binocular stereoscopic method |
||
|---|---|---|---|---|
| Left eye | Right eye | Left eye | Right eye | |
| A | 1.009 | 1.012 | 0.859 | 0.970 |
| B | 0.862 | 0.846 | 0.587 | 0.579 |
| C | 0.902 | 0.765 | 0.581 | 0.534 |
| D | 0.526 | 0.529 | 0.326 | 0.376 |
| Average value | 0.825 | 0.788 | 0.588 | 0.615 |
4.3 Relationship between Convergence and Accommodation Responses
In this section, we consider the results for each participant in further detail, while discussing the relationship between the convergence and accommodation responses, including consideration of the target resolution.
Here, we discuss the experimental results concerning the relationship between the convergence and accommodation responses. It is known that the convergence and accommodation control mechanisms are not entirely independent, but have mutual influence. The accommodation responses to the binocular stereoscopic targets have been explained by taking convergence accommodation and the depth of field of ocular optics into account11). Specifically, the depth of field of the human eye is known to be ±0.2 to 0.3 D9), and convergence-induced accommodation can result in focusing on the retina when viewing with the binocular stereoscopic method within this range. In our experiments, the target positions were in the range from 500 mm (-2 D) to 750 mm (-1.33 D), which was within the range of ±0.33 D from the 3D display (-1.67 D), so they were mostly within the depth of field noted above. On the other hand, the target positions at 450 mm (-2.22 D) and 900 mm (-1.11 D) were approximately ±0.56 D from the 3D display equipment and outside of the depth of field. This may have been why the accommodation responses were particularly low for participant C when viewing targets with the binocular stereoscopic method at the 450 mm (-2.22 D) and 900 mm (-1.11 D) positions (Fig. 5).
However, the differences in the accommodation response results for different target presentation methods were almost the same for participant A at all target positions as shown in Fig. 5. It is known that when viewing with the binocular stereoscopic method, the range of the convergence-induced accommodation response increases as the resolution of the target decreases10). Figure 8 shows the theoretical values of the target resolution for the integral and binocular stereoscopic methods used in the experiments. It shows that the target resolution decreases with increasing distance from the 3D display. The participant A’s accommodation response when viewing targets with the binocular stereoscopic method changed in the same way as when viewing real objects may have been due to the change in convergence-induced accommodation. Other possible factors are that the convergence-induced accommodation was stronger for participant A than for the other participants, and that the depth of field in the optical systems of her eyes was greater.
As shown in Fig. 8, the resolution of the targets for the integral method decreases with increasing distance from the 3D display owing to the capabilities of the 3D display equipment used in these experiments. As can be seen from the results in Fig. 4 and Fig. 5, when viewing targets with the integral method, the accommodation induction effect toward the target position was small compared with that on the convergence response. In particular, the accommodation response results at a viewing distance of 450 mm (-2.22 D) for both the binocular stereoscopic and integral viewing methods were far from the results for viewing real objects.
For the integral method, it has been reported that as the target resolution increases, the accommodation induction effect toward the target presentation position increases3). On the other hand, it has been reported that for the binocular stereoscopic method, as the target resolution decreases, the accommodation induction effect toward the target display position increases10). In our experiments, we decreased the resolution of the targets used for the binocular stereoscopic method to match the target resolution of the integral method. These experimental conditions facilitated accommodation toward the target position when using the stereoscopic method. The accommodation position was induced by the edges of the target; therefore, it will be necessary to develop a 3D display equipment for which a decrease in resolution does not occur. Therefore, it is considered that the accommodation positions of high-resolution I3D targets will be close to the target depth positions. Conversely, in binocular stereoscopic viewing, the effect of convergence-induced accommodation decreases as the resolution of the 3D image increases, so we only expect the accommodation response to follow within the depth of field, unlike when viewing real images.

5. Conclusion
We measured the convergence and accommodation responses to integral targets, binocular stereoscopic targets, and real objects. The results indicated that there are not large differences in the convergence response between viewing with the integral method, viewing binocular stereoscopic images, and viewing real objects. On the other hand, the experimental results for the accommodation response indicated different characteristics when viewing with the integral method and viewing binocular stereoscopic images. The results for the integral method were closer to those when viewing real objects than the binocular stereoscopic viewing results. These experimental results suggest that the integral method will provide more natural 3D viewing, closer to the viewing of real objects, than stereoscopic viewing. Detailed analysis of the experimental results also suggests that as the resolution of 3D images using the integral method increases, the accommodation response will become closer to that when viewing real objects.